|
Corresponding author: Dmitry Vasilyev ( for.vasiliev@gmail.com ) © 2017 Non-profit partnership “Voprosy Ekonomiki”.
This is an open access article distributed under the terms of the Creative Commons Attribution License (CC BY-NC-ND 4.0), which permits to copy and distribute the article for non-commercial purposes, provided that the article is not altered or modified and the original author and source are credited.
Citation:
Vasilyev D, Busygin V, Busygin S (2017) Testing and interpreting uncovered interest parity in Russia. Russian Journal of Economics 3(2): 158-173. https://doi.org/10.1016/j.ruje.2017.06.003
|
Abstract
The failure of uncovered interest rate parity (UIP) is a well-known phenomenon of the last thirty years. UIP failure is more prominent in advanced economies than in emerging market economies. Typically, UIP estimation for an advanced economy generates a negative coefficient, meaning that a higher interest rate in advanced economy A will result in the appreciation of economy A's exchange rate. For emerging market economies, higher interest rates usually correspond to future depreciation, although this depreciation is not sufficient for UIP to hold. This paper shows that UIP holds in Russia better than in other emerging market economies when the UIP equation accounts for a constant risk premium. Consequently, there is no forward premium puzzle for Russian data for 2001–2014. To determine the results for Russia and to compare them with the results for other countries, we estimate UIP first for Russia and then for advanced and emerging market economies using seemingly unrelated regressions and panel data analysis. By comparing the profitability of static and dynamic carry trade strategies, we also confirm that in emerging market economies, risk premiums are often constant, whereas in advanced economies, risk premiums are almost always volatile. This may explain why UIP holds better in emerging market economies. It also enables us to formulate a hypothesis that macroeconomic policies of emerging market economies (e.g., the accumulation of large foreign exchange reserves) stabilize risk premiums.
Keywords
interest parity, forward premium puzzle, carry trade, risk premium, foreign exchange reserves
1. Introduction
1.1. What is the uncovered parity puzzle and how is it related to carry trade and to the forward premium puzzle
Uncovered interest parity (UIP) has been widely used as an exchange rate prediction tool over the past forty years. Dynamic stochastic general equilibrium (DSGE) models used by central banks also use the uncovered parity of interest rates to simulate exchange rates. UIP failure challenged such models and motivated economists to make ad-hoc amendments to account for deviations from UIP (Adolfson et al.,
UIP is no-arbitrage condition in equilibrium: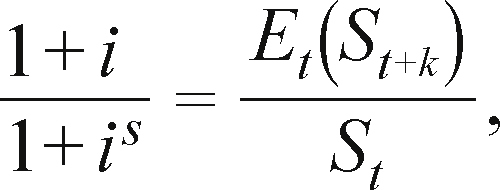 (1)where i is the nominal interest rate and where s is the inverse exchange rate (the value of USD in RUB in our example).
When UIP holds, a higher risk-free interest rate, e.g., in Russia compared to the U.S., denotes expectations for Russian ruble depreciation. A persistent failure of UIP means that investments made in a currency with higher interest rates will earn stable profits due to the interest rate spread between the two countries and due to an increase or insufficient decline in the rate of that currency. The failure of UIP is reflected by the use of carry trade strategies and by the forward premium puzzle.
A forward premium puzzle occurs when UIP is tested using a time series.
At the same time, several studies have demonstrated that the forward premium puzzle can be shown to be non-existent in some cases. For example, the forward premium puzzle is not confirmed over long time periods of five to ten years (Chinn and Meredith,
The carry trade approach is an investment strategy through which an investor borrows in a currency with a low interest rate while at the same time making investments in a currency with a high interest rate. High and sustainable returns ensured by the carry trade strategy have been demonstrated, for example, in
A number of works on exchange rate trends have attempted to explain why interest parity may be not realized while carry trade may earn income. 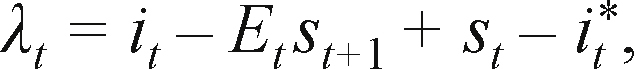 (2)where λ is the deviation from interest parity, i* is the foreign interest rate, i is the domestic interest rate s is the exchange rate logarithm, and Etst+1 is the next period expected exchange rate logarithm.
First, market agents may require higher returns from a foreign asset when there is a premium for the exchange rate risk (Backus et al.,
1.2. Earlier UIP estimates for Russia
For Russia, the hypothesis on deviations from uncovered interest parity, given different exchange rate regimes, is tested in
At the same time, this raises questions regarding how this hypothesis corresponds to those revealed in
If hypotheses formulated in
Exchange rate volatility and UIP realization*.
With a longer time series at our disposal, we attempted to test UIP in Russia between 2001 and 2014. We found that the forward premium puzzle is not verified by Russian data for the period reviewed, including both a period of constantly increasing real exchange rates and a period of higher uncertainty with respect to the exchange rate trend, whereas the β factor is close to one. At the same time, the free constant α in the equation for evaluating UIP over the time series does not equal zero. The significance of the constant term corresponds to the evaluation of the carry trade strategy for Russia. The profitability of carry trade is related to the constant risk premium.
The following text is divided into three sections. The first part verifies that UIP is realized when using Russian data, and it formulates a hypothesis that explains why UIP is realized in Russia but not in the majority of other countries. The second part verifies the existence of a forward premium puzzle in EMEs and AEs and evaluates the role of risk premium volatility in returns on carry trade investments in such countries. The concluding section presents our main findings.
2. Verification of UIP realization using Russian data
2.1. Realization of covered interest parity (CIP)
The simplest proof that CIP holds is that the forward market exists. If covered interest parity were not realized, this would imply that the stable arbitrage serves as an obstacle to market existence (
There are also two standard approaches to check that CIP holds: econometric and descriptive approaches (an analysis of gaps between the actual interest rate and “implied” interest rate based on the forward exchange rate). Using the econometric approach, Gurvich et al. (2010) found that covered parity has been realized in Russia based on data for September 2001 to July 2008. Our paper presents a descriptive analysis of data for August 2005 to May 2014.
 (3)where ft is the forward rate; st is the spot rate; and i* is the foreign interest rate (LIBOR in USD).

During the crisis, covered parity did not hold for a great number of currencies as a result of the sharp rise in the counterparty risk premium (this premium is usually considered to be effectively zero for short-term inter-bank loans; see
We can see that CIP held 2001 to 2014, except for the crisis period. The volatility of mosprime_implied around the mosprime series (see
2.2. Deviations from UIP: carry trade and the forward premium puzzle
2.2.1. Carry trade
Average carry trade returns on the ruble exceeded 4% from 2001 to 2014 (except during the 2008–2009 crisis). Dynamic carry trade (equation 4) yielded 4.61% on average, and static carry trade (equation 5) yielded 5.63%. We use the same method to evaluate the role of risk premium volatility as that used in  (4)
(4) (5)where xdyn is the returns on dynamic carry trade, xstat is the returns on static carry trade, and sign(...) returns the sign of the expression in parentheses.

There are reasons to believe that a constant risk premium underlies returns on carry trade transactions for the ruble. If the forward premium puzzle is explained by the volatility of risk premiums, then we should see no forward premium puzzle in Russia's case.
2.2.2. Forward premium puzzle
No forward premium puzzle is observed from monthly Russian data for the period of 2001 to 2014. The β factor in equation  (6)where α is a constant, β is the estimated coefficient, and ɛ is the error.
Below are the estimates of the β factor based on the simple least squares method and on weighted least squares for the entire sample and for the sample excluding months of the 2008–2009 crisis (
β parameter for Russia.
(0.63) |
(0.55) |
|
(0.30) |
(0.20) |
Including the 2008–2009 crisis period in the sample would be inappropriate, as covered interest parity did not hold at that time. However, losses incurred during currency crises may offset returns on foreign exchange carry trade strategies. Due to this offset uncovered interest parity may hold over longer time horizons.
Weighted least squares is used to account for increased variance in the errors after 2008.
2.3. Main results and their interpretation
As is shown above, the forward premium puzzle was not observed in the RUB– USD pair between August 2001 and May 2014 except for the period running from October 2008 to February 2009, when the CIP was not realized. Therefore, the transition from targeting the USD to targeting the dual-currency basket did not entail a forward premium puzzle (UIP failure) as assumed in Sokolov et al. (2009). The rise in uncertainty with respect to the real exchange rate of the ruble after 2008 and 2009 did not lead to a forward premium puzzle either, as could be assumed from the hypothesis in
UIP holds when we include the constant term in equation
The interpretation of the significant constant in equation
The period under consideration can be divided into two parts: before and after the 2008–2009 crisis. The first part is characterized by rapid economic growth, an inflow of capital, the accumulation of foreign debt in foreign currencies, a stable increase in the real exchange rate despite attempts to target the exchange rate, and an accumulation of international reserves. After the crisis, the economy witnessed considerably slower growth, increased and stabilized spread between rates on Russian and global inter-bank markets, the Bank of Russia transitioning towards inflation targeting, real rates on deposits exceeding zero more often (

Real interest rates in Russia.
Sources: Bank of Russia; Haver Analytics; authors’ calculations.
The trend towards a continuous ruble appreciation and increased capital inflow (observed until the 3rd quarter of 2008) stopped. The rate became more difficult to predict after 2008. Contrary to the hypothesis of
Hypothetical explanation of the facts implies that UIP held in Russia in the 2000s and thereafter, if the constant currency risk premium is taken into account. The constant value of the risk premium is attributable to two factors:
- the vast majority of foreign debt was denominated in foreign currencies;
- the Bank of Russia accumulated reserves, providing “insurance” for banks and for major companies, which in turn accumulated foreign debt.
This hypothetical explanation is supported by the following empirical facts. Foreign exchange risk was borne by foreign debt borrowers, i.e., major national banks and companies. From 2004 to 2014, the share of foreign debt denominated in Russian rubles ranged between 15% and 25% (

Currency composition of foreign debt in Russia (%).
Sources: Bank of Russia; Haver Analytics.
The considerable reserves accumulated by the Bank of Russia insured banks and companies against foreign exchange risk. The Bank of Russia supported the banking sector during the foreign exchange crises of 2014 and 2015 and primarily in 2008 and 2009.
EMEs tended to accumulate large international reserves while the private sector accumulated short-term foreign debt (Rodrik,
The foreign debt functioned as a source of cheap investment financing for banks and major companies in Russia while the ruble was on the rise. International reserves acted as insurance. The growth of reserves was accompanied by an increase in the money supply and by high inflation, costs that the economy had to endure while accumulating foreign debt and international reserves.
In Russia's case, the accumulation of debt by the private sector and the simultaneous accumulation of reserves by the Central Bank resulted in low borrowing costs for banks. This was at least one of the factors that kept the real rate on deposits below zero (see
3. UIP in advanced and emerging market economies
We can use data on AEs and EMEs to test the hypothesis formulated in the above section, according to which the risk premium is less volatile in economies where the foreign exchange risk of economic agents is insured by the central bank. Consequently, such economies have no forward premium puzzle.
First, we verify the existence of a forward premium puzzle for two groups of countries. The test results show that this phenomenon is almost non-existent in EMEs. Moreover, the significance of the free constant in equation
3.1. The forward premium puzzle in AEs33We included South Korea, which became an advanced economy relatively recently, the unique city state of Singapore, and the autonomous city of Hong Kong in the group of EMEs. and EMEs
Equation
We excluded observations related to periods in which the CIP did not hold from the series, following DellaCorte et al. (2015). We used monthly data and month-ahead forward rates.
The results of the panel analysis reveal differences between AEs and EMEs and are consistent with the results of
Testing interest parity.
According to
Tables
Weighted least squares method—SUR.
Weighted least squares method.
3.2. Carry trade in EMEs and AEs
For each of the 38 countries reviewed, we compared returns on both the dynamic and static carry trade

If the point in the chart is lower than the bisector, then the returns on dynamic carry trade exceed returns on static carry trade for the given currency. As we can see, the majority (8 out of 10) of AEs’ currencies provided higher returns on dynamic carry trade. Only 10 of 28 currencies of EMEs provided higher returns on dynamic carry trade.
3.3. Summing up and testing the hypothesis
Comparisons of equation (6) evaluations and the behavior of risk premiums for certain countries.
4. Conclusion
This study shows that the data for Russia do not confirm the existence of a forward premium puzzle. If the uncovered parity equation accounts for the constant risk premium in the form of a constant term, based on monthly data for 2001 to 2014, we can state that uncovered interest parity holds in Russia. The existence of a significant constant term is consistent with the fact that carry trade returns in Russia are driven by a constant risk premium.
By comparing these empirical facts with specific features of the Russian economy, we find a hypothetical explanation for why UIP holds in Russia and not in most other countries. We can assume that high reserves of the Central Bank acted as insurance against foreign exchange risk for economic agents accumulating foreign debt in foreign currencies. This hypothesis can also explain differences in returns on carry trade portfolios found in
Although this hypothesis appears to be credible, it cannot be proven based on data for EMEs and AEs at this point in time. This may be related to our insufficient understanding of the specifics of other economies and consequently to our failure to take them into account in verifying UIP. At the same time, testing UIP based on data for EMEs and AEs confirms earlier results: the forward premium puzzle does not exist for the group of EMEs studied (Bansal and Dahlquist,
Like Hassan and Mano (2014), and Burnside (2015), we define risk premiums as returns on the carry trade foreign exchange portfolio.
This paper lists only some measures used by the Bank of Russia. A detailed description of anti-crisis measures used by the Russian government can be found in: IMF (2009, p. 10; 2012a).
We included South Korea, which became an advanced economy relatively recently, the unique city state of Singapore, and the autonomous city of Hong Kong in the group of EMEs.
We used the Bloomberg source for forward rates: RUB1M: BGN.
For an explanation of the calculations, see Section 2.2 above, equations (4) and (5).
Hong Kong and Singapore have higher returns on dynamic carry trade.
Reserve sufficiency metric values are 143% for Indonesia, 155% for India, and 187% for Thailand while the norm ranges between 100% and 150% (IMF, 2015).
References
- Adolfson, M., Laseen, S., Linde, J., & Villani, M. (2007). Bayesian estimation of an open economy DSGE model with incomplete pass-through. Journal of International Economics, 72(2), 481-511.
- Alfaro, L., & Kanczuk, F. (2013). Debt redemption and reserve accumulation. Harvard Business School Working Paper.
- Baba, N., & Packer, F. (2009). Interpreting deviations from covered interest parity during the financial market turmoil of 2007-2008. Journal of Banking & Finance, 33(11), 1953-1962.
- Backus, D.K., Foresi, S., & Telmer, C.I. (2001). Affine term structure models and the forward premium anomaly. Journal of Finance, 56(1), 279-304.
- Bansal, R., & Dahlquist, M. (2000). The forward premium puzzle: Different tales from developed and emerging economies. Journal of International Economics, 51(1), 115-144.
- Bilson, J.F.O. (1981). The “speculative efficiency” hypothesis. Journal of Business, 54(3), 435-451.
- Brandt, M.W., Cochrane, J.H., & Santa-Clara, P. (2006). International risk sharing is better than you think, or exchange rates are too smooth. Journal of Monetary Economics, 53(4), 671-698.
- Burnside, C. (2015). The carry trade in industrialized and emerging markets. In C. RaddatzD. Saravia & J. Ventura, Global liquidity, spillovers to emerging markets and policy responses, (pp. 245-280). Santiago, Chile: Central Bank of Chile.
- Burnside, C., Eichenbaum, M., & Rebelo, S. (2012). Understanding the profitability of currency- trading strategies. NBER Reporter, 3.
- Chinn, M., & Meredith, G. (2004). Monetary policy and long-horizon uncovered interest parity. IMF Staff Papers, 51(3), 409-430.
- Chinn, M.D. (2006). The (partial) rehabilitation of interest rate parity in the floating rate era: Longer horizons, alternative expectations, and emerging markets. Journal of International Money and Finance, 25(1), 7-21.
- Chinn, M.D., & Quayyum, S. (2012). Long horizon uncovered interest parity re-assessed. NBER Working Paper No. 18482.
- Clarida, R., Davis, J., & Pedersen, N. (2009). Currency carry trade regimes: Beyond the Fama regression. Journal of International Money and Finance, 28(8), 1375-1389.
- Engel, C. (2015). Exchange rates and interest parity.
- Evans, M. (2011). Exchange-rate dynamics. Princeton: Princeton University Press.
- Frankel, J., & Poonawala, J. (2010). The forward market in emerging currencies: Less biased than in major currencies. Journal of International Money and Finance, 29(3), 585-598.
- Galati, G., Heath, A., & Mcguire, P. (2007). Evidence of carry trade activity. BIS Qaurterly Review, 3, 27-41.
- Gurvich, E.T., Sokolov, V.N., & Ulyukaev, A.V. (2009). The impact of the exchange rate policy on the interest rates: Uncovered and covered interest rate parity. Zhurnal Novoy Ekonomicheskoy Assotsiatsii, 1-2, 104-126.
- Hansen, L.P., & Hodrick, R.J. (1980). Forward exchange rates as optimal predictors of future spot rates: An econometric analysis. Journal of Political Economy, 88(5), 829-853.
- Hassan, T., & Mano, R. (2014). Forward and spot exchange rates in a multi-currency world. NBER Working Paper No. 20294.
- IMF (2009). Russian Federation: 2009 Article IV consultation: Staff report. Washington, DC: International Monetary Fund (IMF Country Report No. 09/246).
- IMF (2012 a). Russian Federation: Staff report for the 2015 Article IV consultation. Washington, DC: International Monetary Fund (IMF Country Report No. 15/211).
- IMF (2012 b). Russian Federation: Selected issues: Banking sector and financial market conditions. Washington, DC: International Monetary Fund (IMF Country Report No. 12/218).
- IMF (2015). 2015 external sector report. Washington, DC: International Monetary Fund.
- Kollmann, R. (2004). Welfare effects of a monetary union. Journal of the European Economic Association, 2(2–3), 289-301.
- Menkhoff, L., Sarno, L., Schmeling, M., & Schrimpf, A. (2012). Carry trades and global foreign exchange volatility. Journal of Finance, 67(2), 681-718.
- Rodrik, D. (2006). The social cost of foreign exchange reserves. International Economic Journal, 20(3), 253-266.
- Wang, J. (2010). Home bias, exchange rate disconnect, and optimal exchange rate policy. Journal of International Money and Finance, 29(1), 55-78.
- Burnside, C. (2012). Carry trades and risk. In J. JamesI.W. Marsh & L. Sarno, Handbook of exchange rates, (pp. 283-312). Hoboken: NJ: Wiley.
- Della Corte, P., Riddiough, S., & Sarno, L. (2015). Currency premia and global imbalances. Review of Financial Studies, 29(8), 2161-2193.
- Lewis, K.K. (1995). Puzzles in international financial markets.