|
||
|
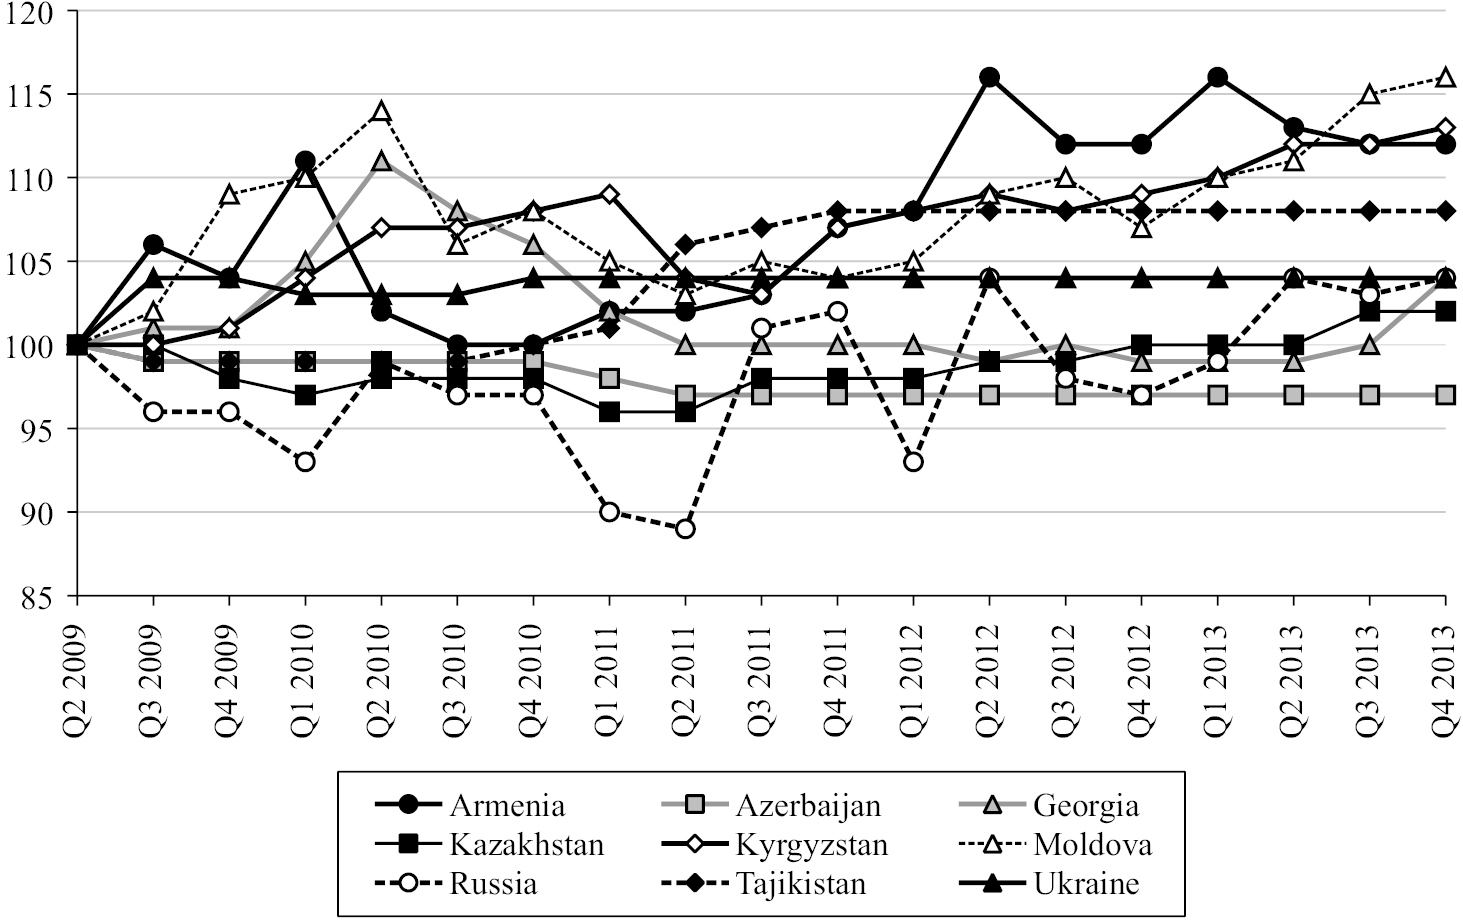
Changes in nominal exchange rates of the FSU currencies against the USD, June 30, 2009 – December 31, 2013 (June 30, 2009 = 100). Note: No data available for Turkmenistan and Uzbekistan; indicators for Belarus go beyond the scale of the graph (see footnote 3). Sources: IMF International Financial Statistics; author’s calculations. |