|
||
|
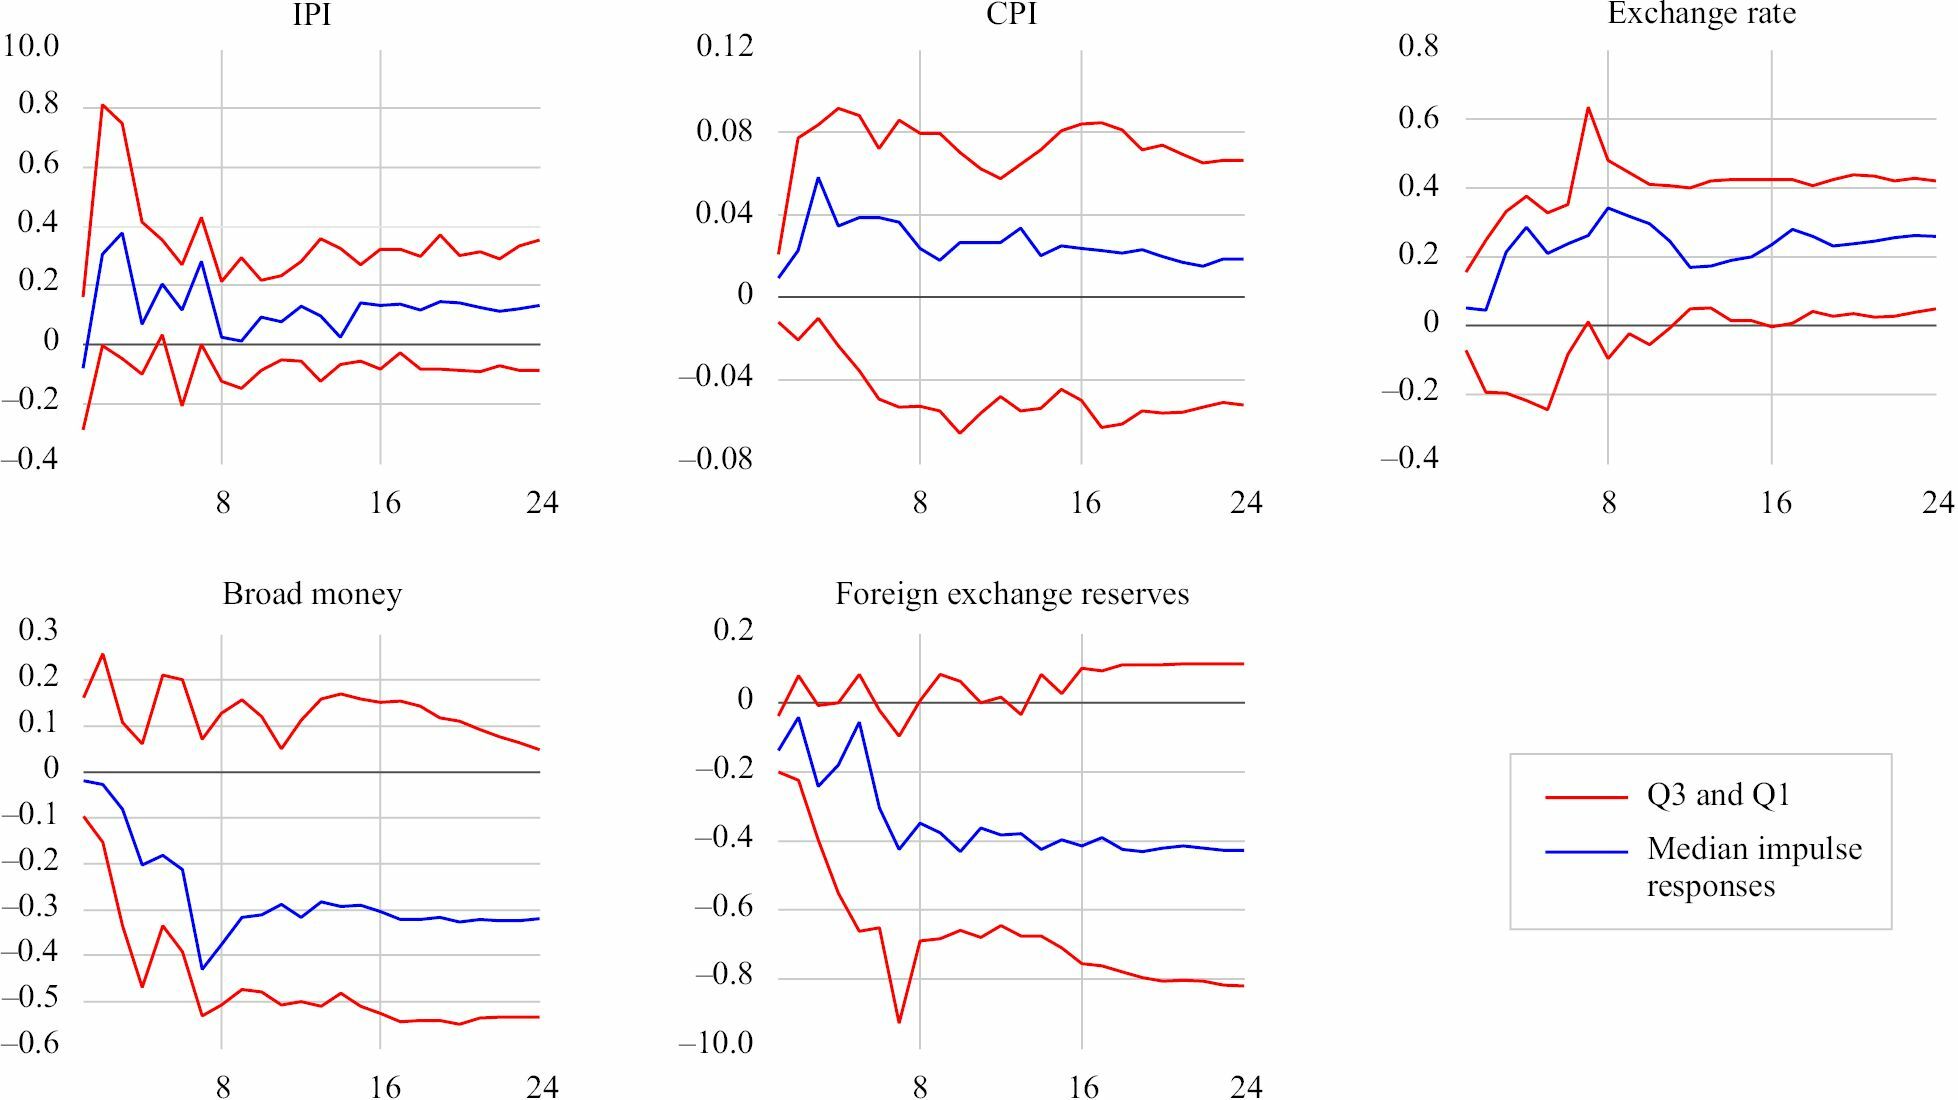
Impulse response functions to shock in US shadow rates. Note: The figure depicts the impulse response functions of EMEs to a one-standard deviation shock (positive shock) in the US interest shadow rates. The horizontal axis represents the time period or horizon, while the vertical axis represents the percent of responses. The range between Q3 and Q1 is the interquartile range. The point-wise median impulse responses represent the impact of a positive shock on the IPI, CPI, exchange rate, broad money (M3), and foreign exchange reserves, respectively. The IRFs show how these factors behave over a period of time in accordance with the shock in the US shadow rate. Source: Compiled by the author. |