|
||
|
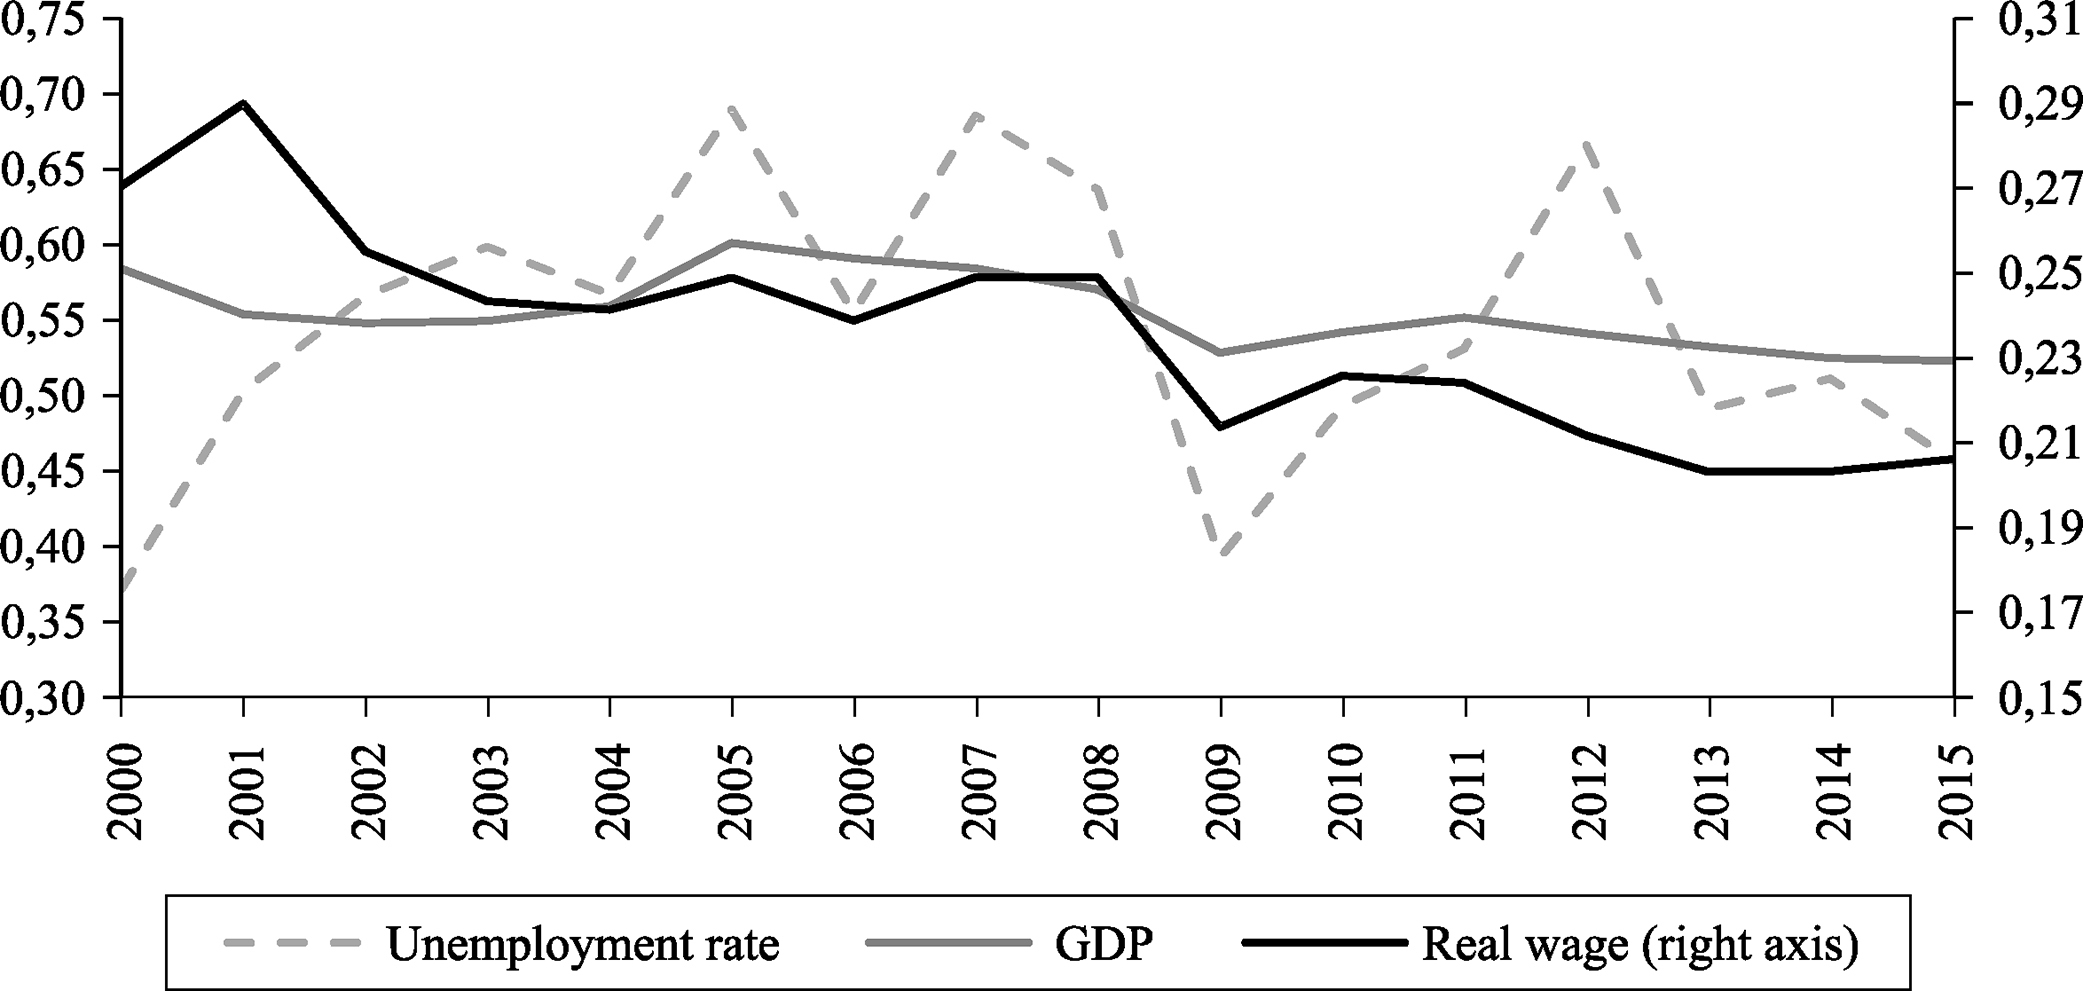
Variation between Russian regions in real wages, unemployment, and GRP per capita. Note: The graph shows 12∑i=1Npi(Xit−X¯t)2 where Xit is the log of real income (or real wage, or unemployment or real GDP per capita) in region i in year t, and X¯t is the population average log of real income (or real wage, or unemployment, or real GDP per capita, respectively) in year t. P and Pi are the population of Russia and of region i, respectively. Source: Rosstat's official data; authors’ calculations. |